Email Sign Up For Our Free Weekly Newsletter
Median home prices enjoy record year-over-year increase of 23.6 percent
According to the National Association of Realtors, existing-home sales decreased for a fourth straight month in May 2021. Only one major U.S. region recorded a month-over-month increase, while the other three regions saw sales decline. However, each of the four areas again registered double-digit year-over-year gains.
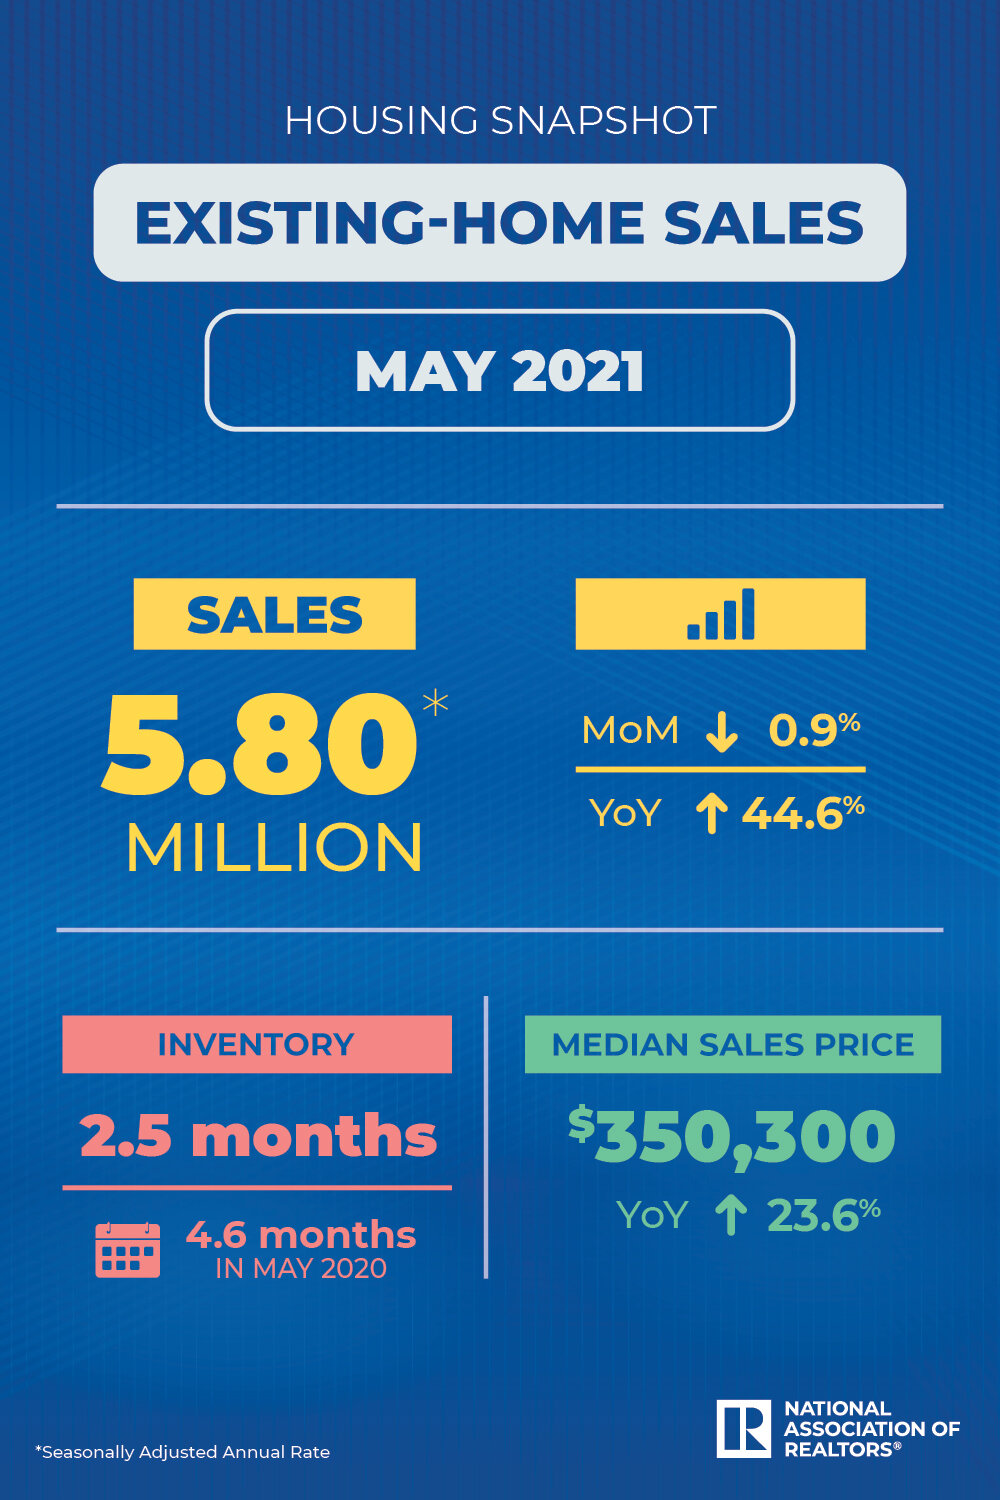
Total existing-home sales, completed transactions that include single-family homes, townhomes, condominiums and co-ops, dropped 0.9% from April to a seasonally-adjusted annual rate of 5.80 million in May. Sales in total climbed year-over-year, up 44.6% from a year ago (4.01 million in May 2020).
Lawrence Yun
“Home sales fell moderately in May and are now approaching pre-pandemic activity,” said Lawrence Yun, NAR’s chief economist. “Lack of inventory continues to be the overwhelming factor holding back home sales, but falling affordability is simply squeezing some first-time buyers out of the market.
“The market’s outlook, however, is encouraging,” Yun continued. “Supply is expected to improve, which will give buyers more options and help tamp down record-high asking prices for existing homes.”
The median existing-home price for all housing types in May was $350,300, up 23.6% from May 2020 ($283,500), as every region registered price increases. This is a record high and marks 111 straight months of year-over-year gains since March 2012.
Total housing inventory at the end of May amounted to 1.23 million units, up 7.0% from April’s inventory and down 20.6% from one year ago (1.55 million). Unsold inventory sits at a 2.5-month supply at the present sales pace, marginally up from April’s 2.4-month supply but down from 4.6-months in May 2020.
Properties typically remained on the market for 17 days in May, unchanged from April and down from 26 days in May 2020. Eighty-nine percent of the homes sold in May 2021 were on the market for less than a month.
First-time buyers were responsible for 31% of sales in May, also even with April but down from 34% in May 2020. NAR’s 2020 Profile of Home Buyers and Sellers – released in late 2020 – revealed that the annual share of first-time buyers was 31%.
Individual investors or second-home buyers, who account for many cash sales, purchased 17% of homes in May, even with April and up from 14% in May 2020. All-cash sales accounted for 23% of transactions in May, down from 25% in April and up from 17% in May 2020.
A new study released by NAR last week – the 2021 Vacation Home Counties Report – found that from January to April 2021, the share of vacation home sales to total existing-home sales rose to 6.7%. Vacation home sales jumped 57.2% year-over-year compared to the 20% year-over-year growth in total existing-home sales.
“The appeal of vacation homes has certainly grown during the pandemic, especially among employees permitted to work from home,” Yun said. “As businesses decide new guidelines for remote workers, even allowing permanent remote options in some cases, look for vacation homes to remain a popular option.”
Distressed sales – foreclosures and short sales – represented less than 1% of sales in May, equal to April’s percentage but down from 3% in May 2020.
According to Freddie Mac, the average commitment rate for a 30-year, conventional, fixed-rate mortgage was 2.96% in May, down from 3.06% in April. The average commitment rate across all of 2020 was 3.11%. Yun expects the 30-year fixed-rate mortgage to remain below 3.5% in 2021.
The Mortgage Bankers Association’s AVP of Economic and Industry Forecasting Joel Kan also commented, “Existing-home sales continue to be weighed down by rising prices and low inventory. Sales in May fell for the fourth straight month to the slowest annual pace since June 2020. However, housing demand is still very strong. Even with this declining trend, sales last month were still much higher than in May 2019.
“The median sales price once again surged to a record high at $350,300. For context, the median price was around $295,000 in 2020 and just under $270,000 in 2019.
“One positive development was the 7 percent increase in for-sale inventory, which should slightly help price conditions. However, the stagnating first-time buyer share at 31 percent, along with the rapidly increasing median sales price, are signs that affordability is an ongoing challenge at the lower end of the market.”
Single-family and Condo/Co-op Sales
Single-family home sales dropped to a seasonally-adjusted annual rate of 5.08 million in May, down 1.0% from 5.13 million in April, and up 39.2% from one year ago. The median existing single-family home price was $356,600 in May, up 24.4% from May 2020.
Existing condominium and co-op sales were recorded at a seasonally-adjusted annual rate of 720,000 units in May, unchanged from April but up 100.0% from one year ago. The median existing condo price was $306,000 in May, an annual increase of 21.5%.
Regional Breakdown
- For the second straight month, only the Midwest experienced higher sales from the prior month.
- Existing-home sales in the Northeast decreased 1.4% in May, but the annual rate of 720,000 is a 46.9% jump from a year ago. The median price in the Northeast was $384,300, up 17.1% from May 2020.Existing-home sales in the Midwest rose 1.6% to an annual rate of 1,310,000 in May, a 27.2% increase from a year ago. The median price in the Midwest was $268,500, an 18.1% increase from May 2020.
- Existing-home sales in the South declined 0.4%, posting an annual rate of 2,590,000 in May, up 47.2% from the same time one year ago. The median price in the South was $299,400, a 22.6% jump from one year ago.
- Existing-home sales in the West fell 4.1%, recording an annual rate of 1,180,000 in May, a 61.6% climb from a year ago. The median price in the West was $505,600, up 24.3% from May 2020.
